The Lesser Kestrel: Natal Dispersal In Compliance With The MRW Model
The Multi-scaled random walk (MRW) model defines a specific dispersal kernel for animal movement; a power law, which is qualitatively different from standard theory (a negative exponential function). Alcaide et al. (2009) analyzed long-term ringing programmes of the lesser kestrel Falco naumanni in Western Europe, and showed results from re-encounters of 1308 marked individuals in Spain. They found that most first-time breeders settled within 10 km from their natal colony (i.e., a strong philopatric tendency), with a negative association between natal dispersal and geographical distance. While Alcaide et al. (2009) were mainly concerned with gene flow and population effects, here I take a deeper look at their dispersal data and find strong support for MRW-compliant behaviour in the natal dispersal data. Indirectly, this pattern at the individual level also supports the MRW-analogue at the population level, the Zoomer model (Gautestad 2015).
I allow myself to copy their Figure 1, showing the natal dispersal distances:
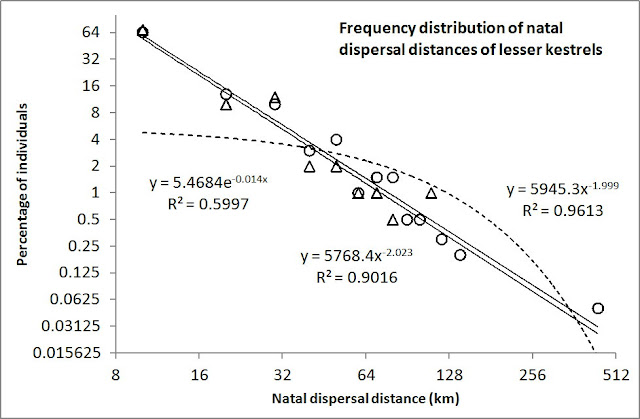
Fig. 1. Frequency distribution of natal dispersal distances of lesser kestrels in the Guadalquivir Valley (SW Spain, N = 321 individuals, black bars; Negro et al. 1997) and in the Ebro Valley (NE Spain, N = 961, white bars; Serrano et al. 2003).
To visualize the difference between the expected dispersal kernel from MRW and from standard theory I here present the data above with log-scaled axes. Under this transformation, compliance with a power law should resemble a straight regression line, with a slope that is defined by the power exponent. Such log-log linearity of a power law contrasts with a log-log transformed negative exponential function, which becomes convex. Interestingly, the two subsets of natal dispersal distances show strong compliance with a power law (R2=0.90 and R2=0.96, respectively), while the best-fitting negative exponential does not match the pattern that well (R2=0.60; dotted line).
Quite remarkably, even the power exponents (β=-2.02 and β=-2.00) show up very close to the standard MRW expectancy of β=-2 (Footnote 1). This particular magnitude of β is – according to MRW theory – expected from scale-free space use where the individual on average during the sampling period has put equal effort into utilizing its environment over the given scale range (in this case, from a spatial grain resolution of 10 km to an extent resolution of 440 km).
The discovery of natal dispersal data as summarized by Alcaide et al. (2009) allows me – for the first time – to study empirical model compliance in a species at relatively coarse temporal scales; i.e., over the interval from birth to first breeding the following year or two. Previous resolutions for MRW tests have typically been at temporal resolution of a few hours (GPS relocation data). Simultaneously, the good fit to power exponent β=-2, even at this coarse temporal scale, translates to β’=-1 in area terms rather than distances (Gautestad and Mysterud 2005). I recycle an illustration of this population kinetic aspect, which was also shown in a previous post (search Archive: "Lab mice"), and in my book:
 The grey-shaded inset represents the classic dispersal kernel, expected from standard random walk at the individual level and diffusion at the population level; i.e., a negative exponential. The other elements in the illustration regard MRW (scale free power law, see also Footnote 2).
In particular, observe for the F(L) movement kernel that the coloured rectangle area of each log-scaled interval (bin) for squared distance, L2; representing “effort” by the individual to relate to respective spatial resolutions of their environment, is of similar magnitude when F=(L2)-1 = 1/L2. The area of each of the rectangles is the same. In other words; in a two-dimensional arena, an individual is then utilizing a k times larger landscape resolution 1/k times as frequently. In a population context (the Zoomer model, switching from a Lagrangian to the complementary Eulerian system perspective) – since a k times larger arena is expected to embed k times more individuals in average terms – when β=-2 the population is utilizing the landscape with equal intensity over the given scale range (Gautestad 2015, p122-132).
NOTES
Footnote 1: what about the Lévy flight/walk model, which also predicts a scale-free and thus a log-log linear dispersal kernel? With respect to the lesser kestrel, as well as all other bird species, spatial memory is part of their cognitive capacity. A home range, which requires directed returns to previous locations, is exemplifying this utilization. MRW regards a combination of scale-free space use and site fidelity. Lévy flight only regards the former.
Footnote 2: With respect to lesser kestrel’s natal dispersal, the data represents the displacement distribution of many individuals (called an ensemble in statistical mechanics) rather than the distribution of a set of displacements for a given individual. Thus, the power law curve reflects these individuals’ pooled tendency for scale free space use during natal dispersal. When establishing their respective home ranges with centre of activity at the chosen breeding site, it would have been interesting to see whether the median displacement length (and β) for the following 1-2 year period deviated from natal dispersal at the same temporal resolution.
REFERENCES
Alcaide, M., D. Serrano, J. L. Tella and J. J. Negro. 2009. Strong philopatry derived from capture–recapture records does not lead to fine-scale genetic differentiation in lesser kestrels. Journal of Animal Ecology 78:468–475.
Gautestad, A. O. 2015. Modelling parallel processing. pp114-148 in: Animal Space Use: Memory Effects, Scaling Complexity, and Biophysical Model Coherence. Dog Ear Publishing, Indianapolis. 298pp.
Gautestad, A. O. and I. Mysterud. 2005. Intrinsic scaling complexity in animal dispersion and abundance. The American Naturalist 165:44-55.
I allow myself to copy their Figure 1, showing the natal dispersal distances:

Fig. 1. Frequency distribution of natal dispersal distances of lesser kestrels in the Guadalquivir Valley (SW Spain, N = 321 individuals, black bars; Negro et al. 1997) and in the Ebro Valley (NE Spain, N = 961, white bars; Serrano et al. 2003).
To visualize the difference between the expected dispersal kernel from MRW and from standard theory I here present the data above with log-scaled axes. Under this transformation, compliance with a power law should resemble a straight regression line, with a slope that is defined by the power exponent. Such log-log linearity of a power law contrasts with a log-log transformed negative exponential function, which becomes convex. Interestingly, the two subsets of natal dispersal distances show strong compliance with a power law (R2=0.90 and R2=0.96, respectively), while the best-fitting negative exponential does not match the pattern that well (R2=0.60; dotted line).
Quite remarkably, even the power exponents (β=-2.02 and β=-2.00) show up very close to the standard MRW expectancy of β=-2 (Footnote 1). This particular magnitude of β is – according to MRW theory – expected from scale-free space use where the individual on average during the sampling period has put equal effort into utilizing its environment over the given scale range (in this case, from a spatial grain resolution of 10 km to an extent resolution of 440 km).
The discovery of natal dispersal data as summarized by Alcaide et al. (2009) allows me – for the first time – to study empirical model compliance in a species at relatively coarse temporal scales; i.e., over the interval from birth to first breeding the following year or two. Previous resolutions for MRW tests have typically been at temporal resolution of a few hours (GPS relocation data). Simultaneously, the good fit to power exponent β=-2, even at this coarse temporal scale, translates to β’=-1 in area terms rather than distances (Gautestad and Mysterud 2005). I recycle an illustration of this population kinetic aspect, which was also shown in a previous post (search Archive: "Lab mice"), and in my book:

In particular, observe for the F(L) movement kernel that the coloured rectangle area of each log-scaled interval (bin) for squared distance, L2; representing “effort” by the individual to relate to respective spatial resolutions of their environment, is of similar magnitude when F=(L2)-1 = 1/L2. The area of each of the rectangles is the same. In other words; in a two-dimensional arena, an individual is then utilizing a k times larger landscape resolution 1/k times as frequently. In a population context (the Zoomer model, switching from a Lagrangian to the complementary Eulerian system perspective) – since a k times larger arena is expected to embed k times more individuals in average terms – when β=-2 the population is utilizing the landscape with equal intensity over the given scale range (Gautestad 2015, p122-132).
NOTES
Footnote 1: what about the Lévy flight/walk model, which also predicts a scale-free and thus a log-log linear dispersal kernel? With respect to the lesser kestrel, as well as all other bird species, spatial memory is part of their cognitive capacity. A home range, which requires directed returns to previous locations, is exemplifying this utilization. MRW regards a combination of scale-free space use and site fidelity. Lévy flight only regards the former.
Footnote 2: With respect to lesser kestrel’s natal dispersal, the data represents the displacement distribution of many individuals (called an ensemble in statistical mechanics) rather than the distribution of a set of displacements for a given individual. Thus, the power law curve reflects these individuals’ pooled tendency for scale free space use during natal dispersal. When establishing their respective home ranges with centre of activity at the chosen breeding site, it would have been interesting to see whether the median displacement length (and β) for the following 1-2 year period deviated from natal dispersal at the same temporal resolution.
REFERENCES
Alcaide, M., D. Serrano, J. L. Tella and J. J. Negro. 2009. Strong philopatry derived from capture–recapture records does not lead to fine-scale genetic differentiation in lesser kestrels. Journal of Animal Ecology 78:468–475.
Gautestad, A. O. 2015. Modelling parallel processing. pp114-148 in: Animal Space Use: Memory Effects, Scaling Complexity, and Biophysical Model Coherence. Dog Ear Publishing, Indianapolis. 298pp.
Gautestad, A. O. and I. Mysterud. 2005. Intrinsic scaling complexity in animal dispersion and abundance. The American Naturalist 165:44-55.