Posts

Showing posts from January, 2018

How to Demarcate and Visualize a Scale-Free Home Range?

Image
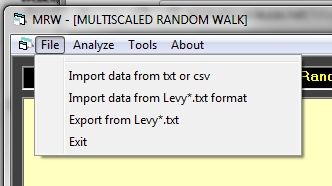
The default method to visualize a home range in the MRW Simulator is to just present the spatial scatter of fixes, without a traditional area demarcation. The scatter then represents a statistical fractal with properties to be explored by various methods. However, some kind of area demarcation has at least a visual appeal and may also be a necessity for some analytical purposes despite its intrinsic sample size dependency. Here I present a home range portrait that is based on an objective criterion from the MRW theory, the Characteristic scale of space use (CSSU). Using the CSSU scale [the unit spatial resolution when interpolating A(N, I ) to (1,1); i.e., “area per square root of N”] and superimposing a square of this size onto each fix in the series of N fixes is in my view a feasible choice. This alternative presentation of a home range outline should be applied after CSSU has been properly estimated using the A(N) regression method (for example, see this post). The text field “pi

MRW and Ecology- Part VII: Testing Habitat Familiarity

Image
Consider having a series of GPS fixes, and you wonder if the individual was utilizing familiar space during your observation period – or started building site familiarity around the time when you started collecting data. Simulation studies of Multi-scaled random walk (MRW) shows how you may cast light on this important ecological aspect of space use. First, you should of course test for compliance with the MRW assumptions, (a) site fidelity with no “distance penalty” on return events, (b) scale-free space use over the spatial range that is covered by your data, and (c) uniform space utilization on average over this scale range. One single test in the MRW Simulator, the A(N) regression, cast light on all these aspects. First, you seek to optimize pixel resolution for the analysis (estimating the Characteristic scale of space use, CSSU). Next, if you find “Home range ghost” compliance; i.e., incidence I expands proportionally with square root of sample size of fixes, your data supports

The MRW Simulator: Importing Your Own GPS Data

Image
You have a large database of GPS fixes, and you wonder if your animals have utilized their habitat in accordance to standard theory of mechanistic movement (the null hypothesis) or in compliance with the MRW theory (the alternative hypothesis). The MRW Simulator is tailormade for this kind of test. If MRW is verified you may proceed with various analyses of behavioural ecology under the alternative statistical-mechanical theory. The initial test procedure is simple: (1) import your data, (2) prepare for a test of model compliance by applying one or more built-in algorithms, and (3) import the generated data tables for statistical test into third party packages (R, Excel, etc.). You can import data to the MRW Simulator by preparing a two-column text file, using comma or TAB as delimiter between the two coordinate values for successive locations. By default you should use the file name import.txt, but other names are also allowed (given the correct data structure). Place the file

The MRW Simulator – Finally Available!

Image
Back in 1997 I started programming the foundation for a personal simulation environment for Multi-scaled random Walk, the MRW Simulator. Through countless updates since then the program has gradually matured into a version which finally is ready for limited distribution towards peers in the field of animal space use research. The MRW Simulator is a Windows©-compliant tool to generate various classes of animal movement (self-produced data series) or to import existing data series. The generated or imported data – consisting of a sequence of (x,y) coordinates – may then be subject to various kinds of statistical protocols through simple menu clicks. The generated text files are then typically exported for detailed analyses and presentation of results in other applications, like the R package or Excel © . While R is based on an interpreted language, the MRW Simulator is a fully complied program. Thus, movement paths of length up to 20 million steps may be simulated within minutes of e

MRW and Ecology – Part VI: The Statistical Property of Return Events

Image
Animals that combine scale-free space use with targeted returns to previous locations generate a self-organized kind of home range. In short, the home range becomes an emergent property from such self-reinforcing revisits. Obviously, any space use pattern from complex processes outside the domain of Markov (mechanistic) theory needs to be analyzed using methods that are coherent with this kind of behaviour. Below I exemplify further the versatility of the MRW approach to adjust for serial auto-correlation (see Part III). I also show the quite surprising model property that the sub-set of inter-fix displacement lengths for return events seems to have a similar statistical distribution as the over-all pattern of exploratory step lengths. This additional emergent property of space use may lead to methods to test a wide range of behaviour-ecological hypotheses, for example to which extent an animal calculates on an energy cost with respect to distance to potential target locations for retu