Posts

Showing posts from March, 2017

The Binary Home Range

Image
In my foregoing post I criticized the Burt legacy (Burt 1943) for hampering progress in analysis of animal space use on a local scale. Analyses of the spatial pattern of GPS fixes – when this has been explicitly explored by multi-scale methods – consistently confirm a statistical fractal with dimension 0.9 < D < 1.2 rather than a paradigm-confirming to-dimensional area demarcation (albeit with fuzzy borders; see below). In an ideal world the D≈1 result should lead to hefty follow-up tests from the community of animal ecologists for the sake of verifying or falsifying the “home range as a fractal”-model and its behavioural-ecological implications. After all, the home range concept is a cornerstone of animal ecology. Nope. The Burt legacy still appears impenetrable. However, things finally seem to start rolling. After a quarter of a century long invitation period following the initial papers on the topic (Loehle 1990; Gautestad and Mysterud 1993, 1994) the application of fractal

Why W. H. Burt is Now Hampering Progress in Modern Home Range Analysis

Image
The term “Home range” (HR) generally follows Burt’s (1943) definition, the area traversed by the individual in its normal activities of food gathering, mating, and caring for young. Occasional sallies outside of the area, perhaps exploratory in nature, should not be considered as home range. However, with respect to fine-grained perception of a HR, Burt’s definition seems to have guided – in fact cemented – the HR concept into a too narrow and partly misleading perception of individual space use. Hence, in my view the Burt definition is hampering progress in this important field of animal ecology. From the perspective of a regional map, an individual’s home range is a zero-dimensional dot. When zooming in towards medium scale, it makes sense to demarcate a home range as a two-dimensional area (or a three-dimensional volume in the context of aquatic or marine systems). The challenge to define HR borders at this scale is reflected in Burt’s second part of his HR definition, leaving som

The Mysterious Taylor’s Power Law – Part IV

Image
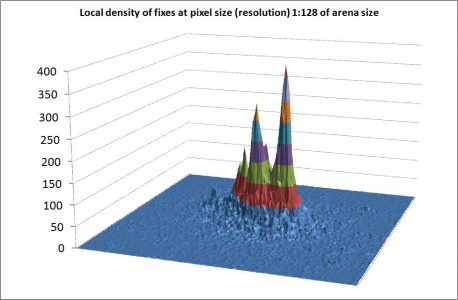
Time to verify theoretical coherence between scale-free population abundance and scale-free space use at the individual level! In this part IV of the Taylor law presentation I analyze a simulated set of GPS fixes rather than studying population abundance. In other words, how does the variance-mean relationship in local density of fixes from the multi-scaled random walk model (MRW) resemble V(M) in a local population under the Zoomer model condition? Through the history spanning more than 1,000 papers this acid test has never previously been successfully performed. My presentation also illustrates the so-called Z-paradox, and how it is resolved under the parallel processing framework for animal space use. The illustration to the right shows the spatial “home range” scatter from a model individual complying with the MRW model. The number of fixes pr. grid cell of resolution k=1:128 (128×128 cells within the defined arena) shows the commonly observed multi-modal utilization distrib