A Coincidence, or Yet Another Confirmation of the Home Range Ghost?
There are now many hundred third-party papers that refer to previously published work on my book’s main model – Multi-Scaled Random Walk (MRW). This week I read with interest one of the most recent additions to this set of references.
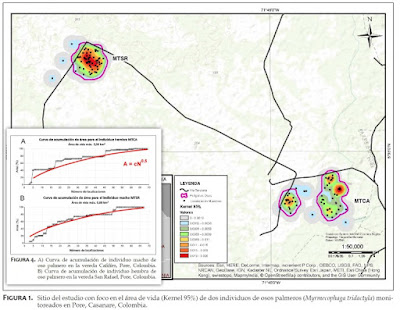
The paper is published in Spanish, with the following English translation “Home range and habitat use of two giant anteaters (Myrmecophaga tridactyla) in Pore, Casanare, Colombia“. Authors: Cesar Rojano Bolaño, María Elena López Giraldo, Laura Miranda-Cortés, and Renzo Ávila Avilán. Edentata 16 (2015): 37–45. Their Figure 4 caught my attention, since it apparently shows a very familiar pattern: the so-called Home Range Ghost. I allow myself to reproduce a sandwich of their Figure 4 and Figure 1. I have also – with kind permission from the authors – added the Home Range Ghost expectation onto the graphs (red lines).
They show how the two giant anteaters’ home ranges apparently expanded non-asymptotically with number of telemetry fixes (in compliance with the authors’ conclusion). Here I have allowed myself to add to that conclusion that the expansion specifically seems to satisfy the generic MRW formula A = cN0.5 (a power law: area expands proportionally with the square root of sample size of fixes).
Are the data really compliant with this power law, or is the area accumulation asymptotic? Here is a simple rule-of-thumb: log-transform both axes! If the plot describes a straight line, you have a power law, with the slope expressing the exponent.
Obviously, two anteaters with only ca 70 fixes in each sample (collected at lag 3 hours) makes no model verification. However, the pattern is at least compliant with extensive empirical tests of the Home Range Ghost aspect of MRW (free-ranging sheep, Black bear, red deer, etc; see Figures 3, 4 and 58 in the book).
As explained in detail in the book the Home Range Ghost is no ghost at all, given that one assumes that the home range is generated by an animal that utilizes its habitat in accordance to the biophysics of the MRW model. The red lines are thus model predictions, based on the underlying theory for parallel processing in combination with spatial memory (upper right edge of The Scaling Cube). In other words, in a MRW scenario the emerging home range from the sample of fixes describes a statistical fractal – “rugged at all resolutions” – rather than a classic area object (whether the border is fuzzy or not).
Further, its interior cannot be properly represented by a utilization distribution. The true “density surface” for a fractal object is non-differentiable (non-smooth). “Forcing” a density distribution function upon such a pattern will be both misleading and produce paradoxical patterns, as exemplified here by the Home Range Ghost.
