Towards an Alternative Proxy for Space Use Intensity
Scale-free exploratory moves and memory-map dependent return events – the MRW model – is here applied as representative of complex space use. Since the spatial dispersion of fixes in the home range’s interior in this scenario self-organizes towards a statistical fractal with dimension D ≈ 1 the utilization distribution (UD) becomes error-prone as a proxy variable for space use intensity. UD depends on space use that satisfies the classic condition D ≈ 2 (“a smooth, differentiable density surface” at fine resolutions). Consequently, from theoretical arguments under condition of complex space use, local density of GPS fixes (the UD) is expected to be a poor indicator of true space use intensity, and thus unfit as optimal indicator of habitat selection. The obvious question then arises, what is the alternative to estimators like the popular kernel density estimation? Here I summarize one such alternative – the individual’s characteristic scale of space use (CSSU).
To make a long story short (the longer one is presented in my book), the alternative to the UD under condition of complex space use is 1/c; where c is a parameter in the Home range ghost formula;
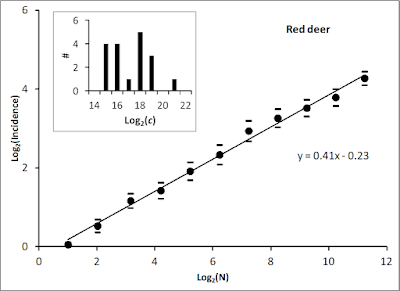 In an extensive analysis of movement by red deer Cervus elaphus we found that space use in these animals showed best compliance with MRW with β ≈ 2.2, which implies fix dispersion’s fractal dimension D ≈ 1.2 and z ≈ 0.4) (Gautestad et al. 2013). By applying the incidence approach to estimate home range area as a function of sample size of fixes, and varying grid resolution to optimize towards c = 1 for N=1; i.e., [log(N),log(c)]=(0,0), we found the respective individuals’ characteristic scale of space use (CSSU).
In a follow-up analysis we estimated c at the home range scale for 18 individuals, as shown by the inset panel in the illustration above (Figure 5B in Gautestad and Mysterud (2013). We have so far not followed up on this analysis by comparing 1/c with the UD, as a proxy for local space use intensity – and thereby an indicator of strength of habitat selection – under respective local habitat conditions. Perhaps readers of this blog want to give it a try on their own data? Additional details on the 1/c method may be found in Chapter 11 of my book, Implications and applications.
REFERENCES
Gautestad, A. O., L. E. Loe, & A. Mysterud. 2013. Inferring spatial memory and spatiotemporal scaling from GPS data: comparing red deer Cervus elaphus movements with simulation models. Journal of Animal Ecology 82:572-586
To make a long story short (the longer one is presented in my book), the alternative to the UD under condition of complex space use is 1/c; where c is a parameter in the Home range ghost formula;
A = c√N
(Area expanding proportionally with square root of sample size). After a simple transformation of this equation, c equals “area pr. square root of N” and thus cancels out the Home range ghost effect on A. In other words, c is expected to be of similar magnitude, whether a large or a small sample size of GPS fixes is applied for its estimate (but a large sample is obviously preferred, for statistical reasons).
Its inverse, 1/c, provides a convenient expression for complex space use intensity. A smaller c leads to a proportionally larger 1/c; i.e., stronger space use intensity. The intensity may – like the classic density variable – be calculated at the scale of the total home range, or a spatial sub-section of this range. In the latter case, local 1/c provides an alternative to the local density within the UD. The premise is of course that space use is complex (memory-influenced and scale-free), rather than following the traditionally assumed Markovian and scale-specific kind of dynamics.
Like the traditional density-based utilization distribution (for example, GPS fixes pr area unit), 1/c also expresses such area-referring intensity. 1/c = 1/(A/√N) = √N/A, rather than the classic N/A.
The “characteristic” scale is then referring to the condition of grid cell size that leads to 1/c = c.
In other words,
A/√N = √N/A ≈ 1
This condition is best illustrated graphically, as log(I) = log(c) + z*log(N). Area is represented by incidence, I (sum of non-empty grid cells), and the power exponent z=0.5 under the default MRW condition (β = 2 in the distribution of step lengths; search Archive for the scaling cube).

Simply stated, when space use is MRW-like - as verified for the red deer data - the characteristic scale equals the grid resolution ("balancing", spatial scale) for which the condition log(c) ≈ 0.
In a follow-up analysis we estimated c at the home range scale for 18 individuals, as shown by the inset panel in the illustration above (Figure 5B in Gautestad and Mysterud (2013). We have so far not followed up on this analysis by comparing 1/c with the UD, as a proxy for local space use intensity – and thereby an indicator of strength of habitat selection – under respective local habitat conditions. Perhaps readers of this blog want to give it a try on their own data? Additional details on the 1/c method may be found in Chapter 11 of my book, Implications and applications.
REFERENCES
Gautestad, A. O., L. E. Loe, & A. Mysterud. 2013. Inferring spatial memory and spatiotemporal scaling from GPS data: comparing red deer Cervus elaphus movements with simulation models. Journal of Animal Ecology 82:572-586
Gautestad, A. O. & A. Mysterud. 2013. The Lévy flight foraging hypothesis: forgetting about memory may lead to false verification of Brownian motion. Movement Ecology 1:1-18.