Posts

Homogeneous or Heterogeneous Environment?
Image
When simulating animal space use – whether at the level of individuals or populations – some of the first conditions to define regard the attributes of the arena. The environment may be simple (homogeneous) or complicated (heterogeneous). As always the choice is a matter of weighing model simplicity against realism. However, another dimension of this choice is often overlooked. Animal space use is always a mixture of intrinsic and extrinsic driving forces. Thus, by simulating in a homogeneous environment one may to some extent disentangle these aspects by studying the intrinsic dynamics first and then – in follow up simulations – adding extrinsic variability. This is an important point to stress, since simple models in homogeneous environment have occasionally been criticized for lack of realism. As an example of how simplicity may contribute to important insight, consider traditional home range simulations (the convection model), observed at a statistical-mechanical temporal scale...
Towards an Alternative Proxy for Space Use Intensity

Image
Scale-free exploratory moves and memory-map dependent return events – the MRW model – is here applied as representative of complex space use. Since the spatial dispersion of fixes in the home range’s interior in this scenario self-organizes towards a statistical fractal with dimension D ≈ 1 the utilization distribution (UD) becomes error-prone as a proxy variable for space use intensity. UD depends on space use that satisfies the classic condition D ≈ 2 (“a smooth, differentiable density surface” at fine resolutions). Consequently, from theoretical arguments under condition of complex space use, local density of GPS fixes (the UD) is expected to be a poor indicator of true space use intensity, and thus unfit as optimal indicator of habitat selection. The obvious question then arises, what is the alternative to estimators like the popular kernel density estimation? Here I summarize one such alternative – the individual’s characteristic scale of space use (CSSU). To make a long stor...

A Statistical-Mechanical Perspective on Site Fidelity – Part I

Image
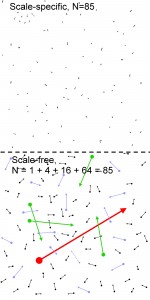
From the perspective of statistical mechanics, surprising and fascinating details continue to pop up during my simulation studies on complex movement. One such aspect regards the counter-intuitive emergence of uneven distribution of entropy over a scale range of space use. In this post I introduce the basics of concepts like entropy and ergodicity, and I contrast these properties under classic (“scale-specific”) and complex (“scale-free”) conditions. In a follow-up Part II of this post I publish the novel, theory-extending property of the home range ghost. Entropy is commonly understood as a measure of micro-scale particle disorder within a macroscopic system. This disorder; e.g., uncertainty with respect to a given particle’s exact location within a given time resolution, is quantified at a coarse scale of space and time. In other words, “the hidden layer” has to be sufficiently deep to allow for a simplified statistical-mechanical representation of the space use (see definition of ...

Home Range as an Emergent Property

Image
An animal is generally constraining its various activities within a limited range of the habitat, relative to what is potentially available to it during the actual period. However, the object we call a home range (HR) may be described by models that represent qualitatively different processes at a very fundamental level. These differences have consequences for statistical analysis and ecological inference. The differences also highlight an inherent paradox of the classic model, and makes one wonder how this approach has survived as a cornerstone of animal space use theory for so long.  A HR is generally and traditionally assumed to be the result of the animal’s tendency to turn back towards more central parts of the range when the distance from centre(s) of activity becomes too large. More specifically, a directional (centre-pointing) bias on direction of movement is assumed to become stronger the more distant the animal moves from the centre. This advection effect, in combinatio...

A Coincidence, or Yet Another Confirmation of the Home Range Ghost?

Image
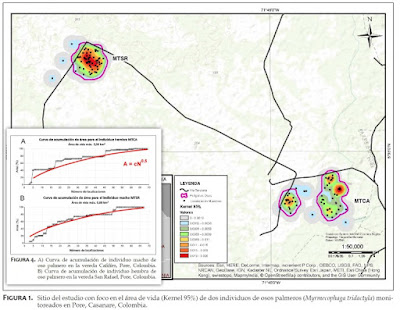
There are now many hundred third-party papers that refer to previously published work on my book’s main model – Multi-Scaled Random Walk (MRW). This week I read with interest one of the most recent additions to this set of references.   The paper is published in Spanish, with the following English translation “Home range and habitat use of two giant anteaters (Myrmecophaga tridactyla) in Pore, Casanare, Colombia“. Authors: Cesar Rojano Bolaño, María Elena López Giraldo, Laura Miranda-Cortés, and Renzo Ávila Avilán. Edentata 16 (2015): 37–45. Their Figure 4 caught my attention, since it apparently shows a very familiar pattern: the so-called Home Range Ghost. I allow myself to reproduce a sandwich of their Figure 4 and Figure 1. I have also – with kind permission from the authors – added the Home Range Ghost expectation onto the graphs (red lines). They show how the two giant anteaters’ home ranges apparently expanded non-asymptotically with number of telemetry fixes (in c...

The Beautiful Anatomy of a Home Range

Image
In an upcoming paper I explore the intrinsic network topology of individual space use, under the premises of site fidelity and multi-scaled habitat use. In short – the process that leads to the emergence of a home range. The illustration below provides a glimpse into this inner structure of nodes (re-visited locations), their respective statistical weight (how often they have been re-visited) and how they are inter-connected. Inter-connectivity describes how some nodes are more closely linked (showing a higher frequency of inter-node commuting) than other nodes. Thus, the inter-node distance in these graphs are expressing the relative degree of connectivity, and not the actual spatial distance between the nodes. For example, two nodes that are close in topological terms – neighbour nodes in the graph to the left – may in fact happen to be distant in space. The most intriguing aspect of the two graphs above regards how the topology matures over time. In the early phase after...

The Scaling Cube

Image
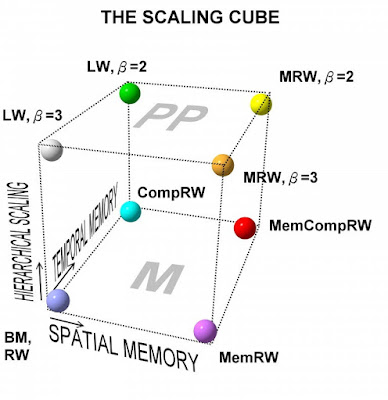
For the first time three directions of animal space use research are unified into a common conceptual model: a three-dimensional biophysical continuum, involving (1) spatial memory, (2) temporal memory, and (3) the animal’s hierarchical perception of the environment. The model is described in detail in Chapter 7 of my book. The spatial memory aspect regards the degree of memory map utilization. The temporal memory aspect regards degree of mixture of high and low frequency of locomotion, like the classic ARS model (area-restricted search) and related kind of composite space use. Hierarchical processing regards simultaneous (in contrast to sequential!) mixture of tactics and strategy (Figure 70, page 197). The common theoretical framework for ecological research – providing the majority of models and statistical procedures – is located in the lower left corner, marked as BM/RW (Brownian motion, classic random walk).  Are you applying methods like the kernel density estimation ...