Posts

The Biophysical Framework’s Potential for Behavioural Ecology

Image
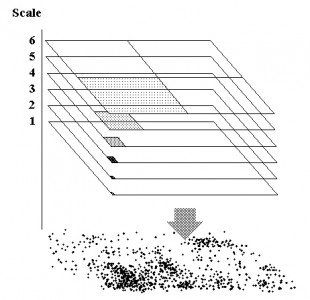
Data collection of individual movement like a series of GPS fixes provides a potential for a physical – a statistical-mechanical – interpretation of animal space use. Such material represents indirect studies of behaviour in contrast to direct observation and interpretation. The GPS pattern of dots on the map provides a coarse-grained image of how the individual in overall terms relocated itself during the period of sampling. It is fascinating that this “out of focus” image may in fact not only be scrutinized with respect to verifying many similar behavioural traits as traditionally studied by ethological methods, but also allows for interpretation of specific relationships that are difficult or outright impossible to test from the classic methods in behavioural ecology. In this post I’m focusing on one of these space use properties, scale-free habitat utilization. First, what is “scale-free movement”? Statistically, this property apparently should be easy to verify (or falsify) by...

Parallel Processing – a Simplistic Introduction

Image
The parallel processing concept (PP) is a core postulate of the Multiscaled random walk model. PP provides the backbone of an attempt to understand in a statistical-mechanically consistent manner why animal movement generally tend to show scale-free distribution of displacement lengths at a given frequency of GPS position sampling (Lévy walk-like movement). Contrary to standard Lévy walk theory, PP-based movement seems to offer a plausible explanation for why superlong displacements – the “long tail” part of the Lévy walk-like step length distribution – may appear even in environments with frequent direction-perturbing events. From standard theory such events should tend to “shorten the tail” by prematurely terminate long steps, and simultaneously inflate the frequency of shorter displacements. Thus, the standard Lévy model is – in my view – lacking some essential aspects of many animals’ cognitive computation of environmental conditions and the individual’s internal state.  In m...

The Mysterious Taylor’s Power Law – Part I

Image
Interesting statistical properties of population dispersion emerge from the simulations of the Zoomer model (search Archive), which represents the population level variant of my Multi-scaled random walk model (MRW). The Zoomer model seems to offer a potential to cast new light on a particular scaling pattern, Taylor’s power law (Taylor 1961, 1986), which has been a nagging stone in the shoe for population ecology for more than 50 years. Taylor’s power law is one of the most widely tested empirical patterns in ecology and is the subject of an estimated thousand papers (Eisler et al. 2008)! Despite this effort, a consensus to explain it has still not been obtained (Kendal and Jørgensen 2011). The scale-free pattern has been observed far beyond animal populations: Taylor’s law is remarkable in that it is evident over the scale of a single chromosome (Kendal 2003, 2004) to the lungs of mice (Kendal and frost 1987), a farmer’s field (Kendal 2002), and upward to the breadth of the Britis...

A Statistical-Mechanical Perspective on Site Fidelity – Part VI

Image
In Part III of this group of posts I described how to estimate an animal’s characteristic scale of space use, CSSU, by zooming over a range of pixel resolutions until “focus” is achieved according to the Home range ghost function I(N)=c√N. This pixel size regards the balancing point where observed inward contraction of entropy equals outward expansion of entropy, as sample size of fixes N is changed. If the power exponent satisfies 0.5 [i.e., square root expansion of I(N)], the MRW theory states that the animal – in statistical terms – had put equal weight into habitat utilization over the actual scale range of space use. In Part V I explained two new statistical-mechanical concepts, micro-and macrostates of a system, but in the context of the classical framework. In this follow-up post I’m approaching the behaviour of these key properties under the condition of complex space use, both at the “balancing scale” CSSU and by zooming over its surrounding range of scales. In other words, wh...

Three Bold Steps for Movement Ecology

Image
Linking the statistical pattern of space use to general models of movement behaviour has always been a cornerstone of animal ecology. However, over the last 10-20 years or so we have seen a rapidly growing interest in studying these processes more explicitly from a biophysical perspective. Biologists and physicists have come together on a common arena – movement ecology – seeking to resolve some key theoretical challenges. There is now a consensus that space use is more complex (in the physical sense of the word) than the traditional text book models have accounted for. In particular, individuals are generally utilizing their environment in a spatio-temporal multi-scaled manner, and species within a broad range of taxa also show capacity for spatially explicit memory utilization (e.g., a memory map). However, despite the emergence of very sophisticated models, movement ecology still has a long way to go to fully embrace these concepts and embed them into a coherent theoretical framewor...

CSSU – the Alternative Approach

Image
In my book and in several blog posts I have described in detail how a spatial scatter of GPS fixes can be analyzed to estimate the animal’s characteristic scale of space use (CSSU). The method is based on zooming the resolution of a virtual grid until the intercept log(c) ≈ 0 and the slope z ≈ 0.5 in the log-transformed home range ghost formula log[I(N)] = log(c) + z*log(N). Incidence, I, regards “box counting” of grid cells that embed at least one fix at the given resolution of the grid. In this post I present for the first time an alternative method to estimate CSSU. Space use that is influenced by multi-scaled, spatial memory utilization tends to generate a GPS fix pattern from path sampling that is self-similar; i.e., the scatter is compliant with a statistical fractal with dimension D ≈ 1. Since D<<2, the dispersion is statistically non-stationary under change of sample size for its estimation (N). This property explains the home range ghost formula with the “paradoxical” ...

The KDE Smoothing Parameter: Approaching the Core Issue

Image
When calculating individual space use by the kernel density estimation (KDE), the smoothing parameter h must be specified. The choice of method to calculate h has a dramatic effect on the resulting estimate. Here I argue that looking for the optimal algorithm for h is probably a blind alley for other reasons than generally acknowledged. Two methods that are used extensively for KDE home-range analysis; the least square cross validation method (LSCV) and the method to determining the optimal h for a standard multivariate normal distribution (Href). In short, both methods have been found to have serious drawbacks. In particular, LSCV is generally under-smoothing the home range representation, leading to a utilization distribution (UD) that tends to be fragmented with many local “peaks”. On the other hand, Href tends to over-smooth the UD. Thus, relative to LSCV the resulting UD suppresses the local peaks in density of fixes and tends to show a larger home range for a given isopleth. ...